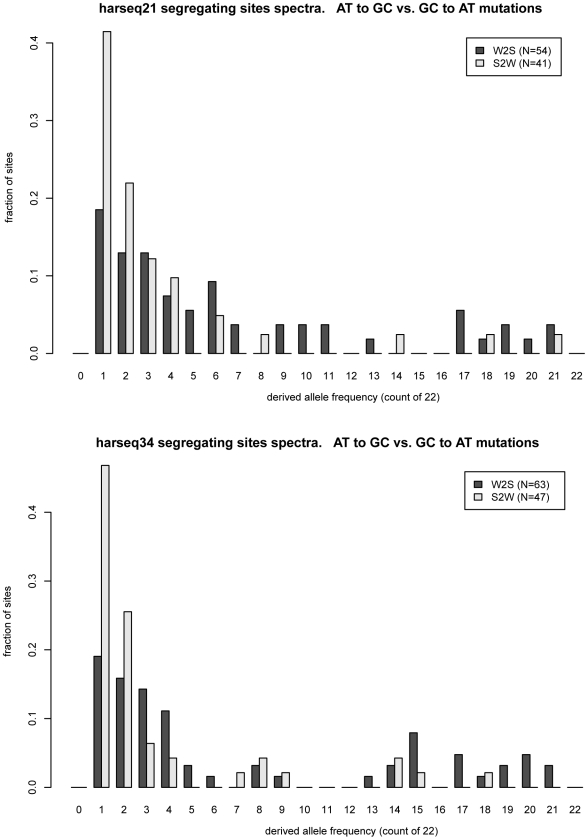
Figure 1. Frequency offset of weak-to-strong versus strong-to-weak mutations.
MWU test is strongly significant for harseq21 (upper panel) and harseq34 (lower panel). This reflects the fact that the derived allele frequency spectrum for weak-to-strong mutations (dark bars) is offset towards higher frequencies compared to strong-to-weak mutations (light bars). N: count of segregating sites of the indicated category in the region.

