Figure 3.
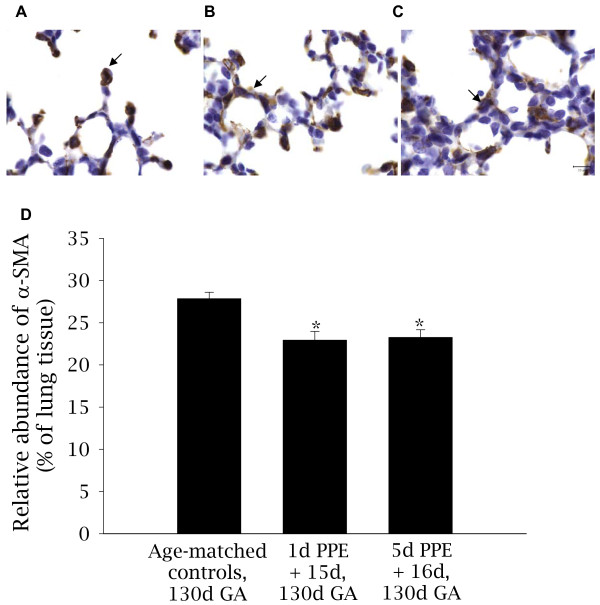
Localization and relative abundance of αSMA in control and embolized fetal lung tissue. Light micrographs depicting the localization of αSMA (brown-black staining); a marker of myofibroblasts, in control (A), 1d PPE + 15d (B), and 5d PPE + 16d (C) lung tissue. Nuclei are counterstained blue with haematoxylin. The arrows show the presence of αSMA at the tips of secondary septal crests (A) and in the primary septal wall (B-C). The scale bar in (C) represents 10 μm in all three images. The relative abundance of αSMA (D) was less in 1d PPE + 15d and 5d PPE + 16d fetuses relative to control fetuses (* p < 0.001).

