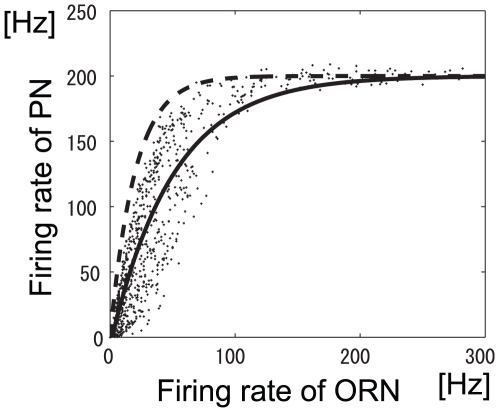
Figure 6. Relationship between ORN and PN responses at peak i.
Dots show all types of ORN responses to all odors at peak i in Fig. 5 (A). The solid line is an exponential fit of the dots ( ). The dashed line shows the same relationship except with LN input set to
  (
( ).
).

