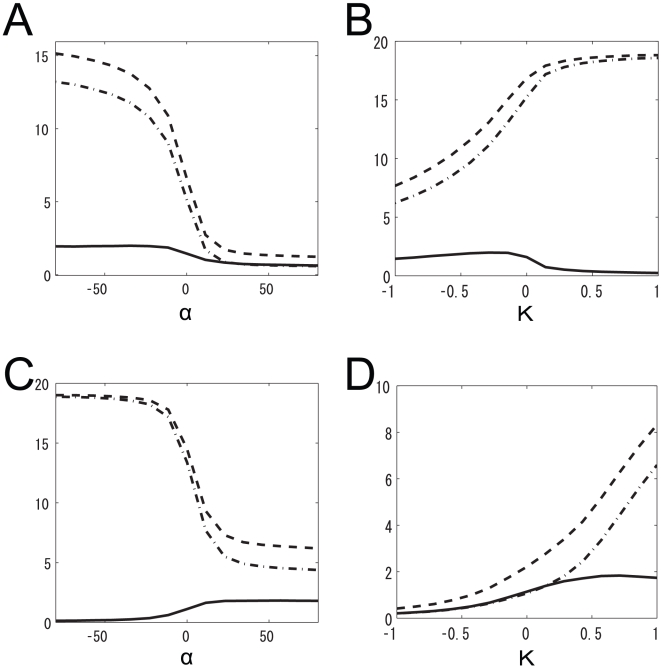
Figure 8. Dependence of the mutual information, entropy, and noise entropy on  and
and  .
.
Solid lines represent the mutual information, dashed lines represent entropy, and dot-dashed lines show noise entropy. (A)  was set to the value at peak i in Fig. 5 (A) (
 ). (B)
  was set to the value at peak i in Fig. 5 (A) (
 ). (C)
  was set to the value at peak e in Fig. 5 (A) (
 ). (D)
  was set to the value at peak e in Fig. 5 (A) (
 ).
).

