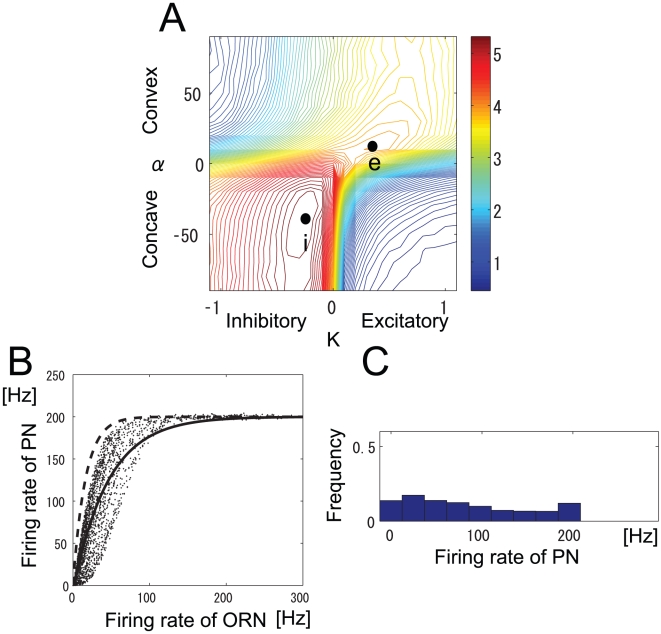
Figure 10. Results of the decoding approach: they are qualitatively the same as those of the information theoretic approach.
(A) Contour plot of estimated mutual information when the intraglomerular transformation shape  and LN input strength
  were varied. Colors show the value of the estimated mutual information. All glomeruli shown in Fig. 2 (A) were used. (B) Relationship between ORN and PN responses at peak i in panel (A). Dots represent all types of ORN responses to all odors. The solid line is an exponential fit of the dots (
 ). The dashed line represents the same relationship except with LN input set to
  (
( ). (C) Histogram of PN response magnitudes at peak i in panel (A).

