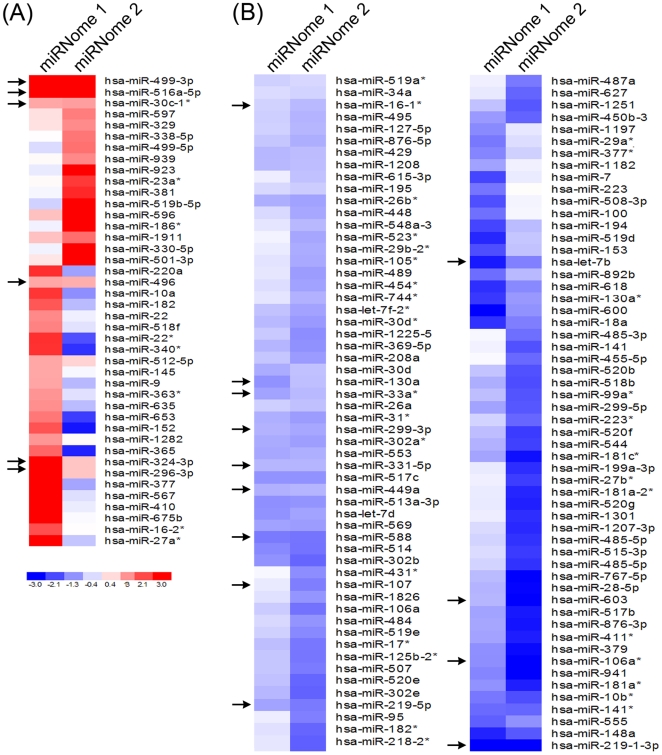
Figure 1. Downregulation of miRNA expression in old individuals.
For each panel, one young 30- year-old participant and one old 64-year-old participant were screened for miRNA expression using a real-time RT-PCR based miRNome miRNA profiler kit as described in Materials and Methods. Different pairs of individuals were used for both miRNome 1 and miRNome 2. The heat map was generated using dChip software and indicates the fold log10 relative change in expression in young versus old participants[49]. The top upregulated and downregulated miRNAs are shown. Blue indicates downregulation of miRNA expression in the old individuals and red indicates upregulation of miRNA expression in the old individuals. Each patient was sex and race matched as indicated in Table 1. A detailed spreadsheet of the data is available as supplementary information (Table S1). * next to the microRNA refers to the minor form of the miRNA.

