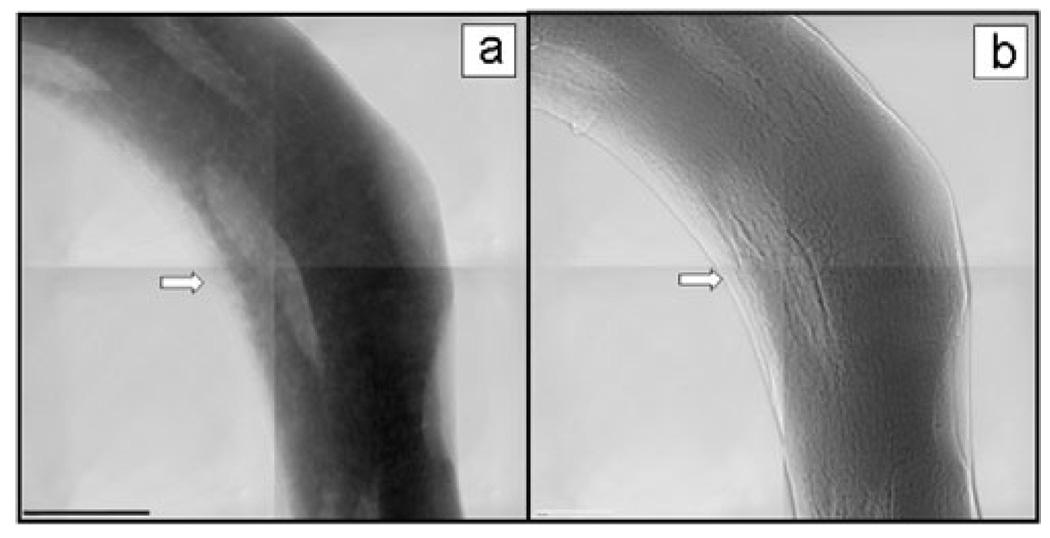
Figure 3.
TXM mosaic images at 5.4 keV of trabecula from mouse cancellous bone of the proximal tibia (a) in absorption contrast and (b) in Zernike phase contrast. Arrow points to the edge of nonmineralized tissue, which is more apparent in the phase contrast image. The FOV of each individual image is (30 µm)2 and scale bar = 15 µm. All images in this article show reference corrected images, in which the raw image is divided by the image without sample. Both brightness and contrast are adjusted, but no further processing was performed.

