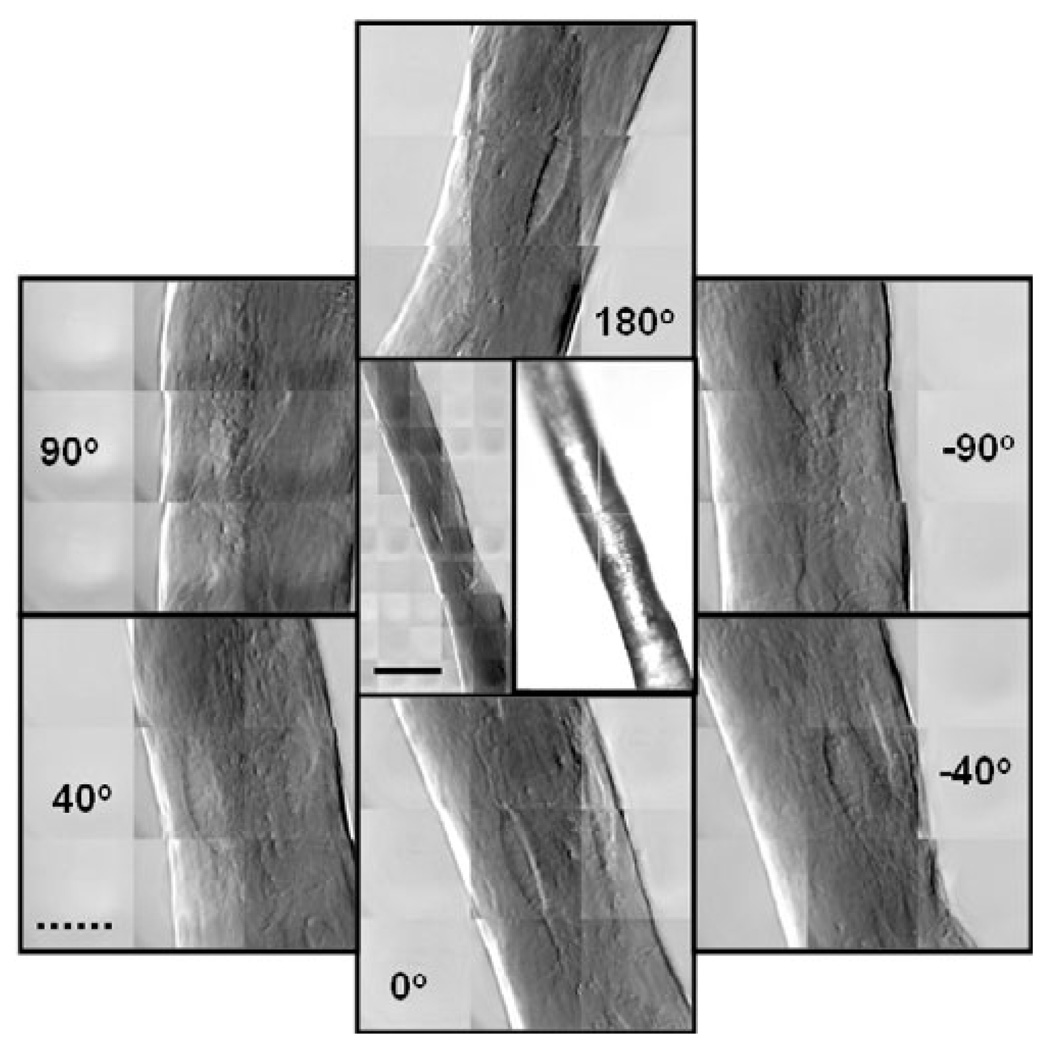
Figure 5.
Center TXM and optical images show a small trabecular strut from a control (not loaded) mouse tibia. Center left image is a 5 × 10 mosaic taken in phase contrast at 8 keV. FOV = (15 µm)2. The right image is from the optical prealignment microscope. The surrounding images are 3 × 3 mosaics at full resolution taken at the indicated angles. The same lacuna can be seen in all the images demonstrating X-ray penetration of the entire sample. Solid scale bar is 30 µm, and broken scale bar is 10 µm.

