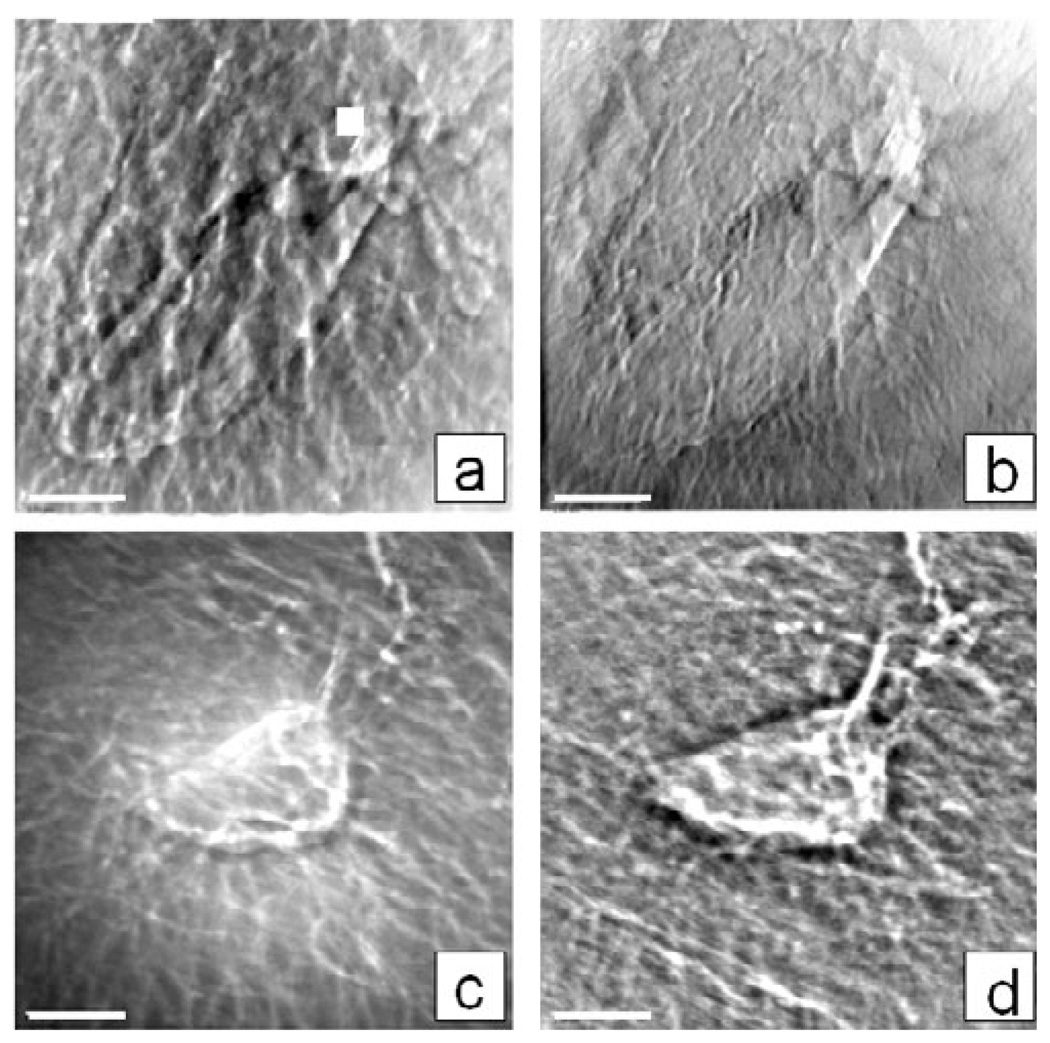
Figure 7.
TXM images at 8 keV of lacunae from mouse tibia trabecula showing differences in the sample preparation and imaging modalities; for example, (a) phase and (b) absorption contrast images of a control (not loaded) uranyl acetate treated sample (1% in water, overnight), and phase contrast images of lacuna (c) before and (d) after Clorox treatment to remove organic material. Images are a single FOV (15 µm) and scale bar is 2.5 µm.

