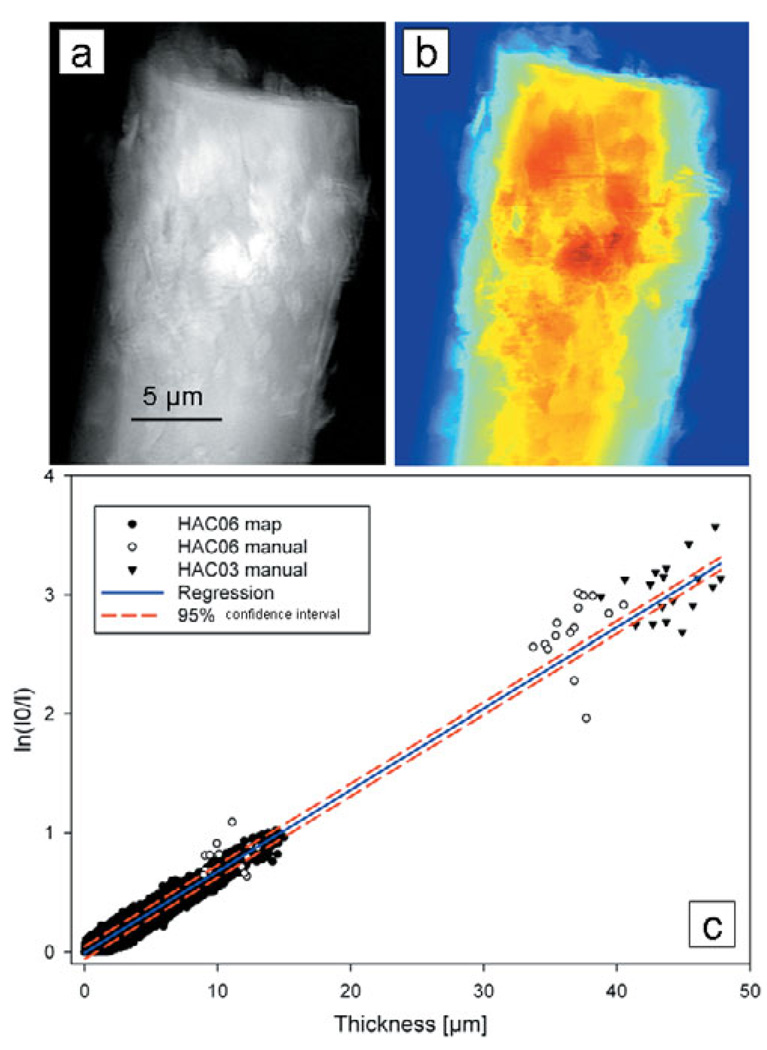
Figure 8.
(a) Absorption (ln(I 0/I)) image of rod-like crystalline chlorapatite sample HA06 and (b) thickness map from reconstructed slices. (c) Plot of absorption versus thickness for two crystalline standards includes points determined manually and using MATLAB. Linear regression yielded an attenuation coefficient of 683 cm−1.

