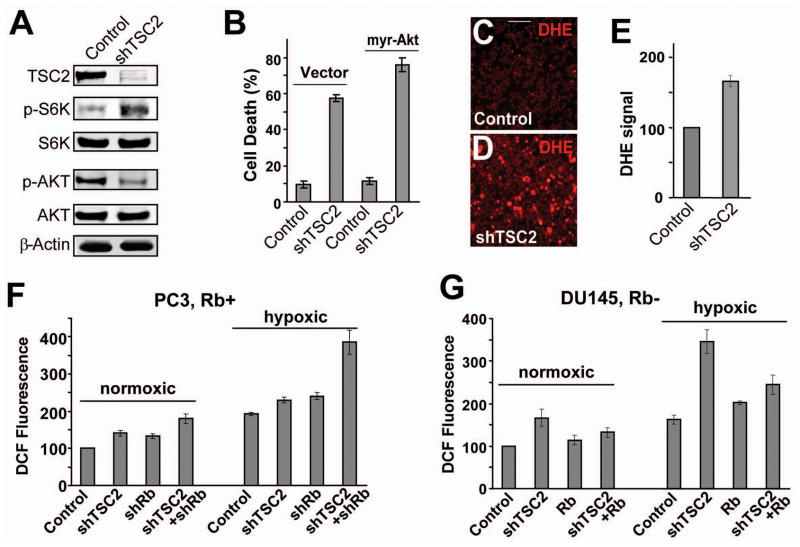
Figure 5. TSC2 knockdown induces ROS generation.
(A) Western blots showing the level of TSC2, phospho-S6K (T389), phospho-Akt (S473), total S6K, total Akt, and β-Actin in control DU145 cells and in DU145shTSC2 cells. (B) Overexpression of constitutively activated myr-AKT did not inhibit shTSC2-induced cell death in DU145 cells. (C and D) DU145shTSC2 cells (D) exhibited significantly higher levels of ROS (detected by the fluorescent dye DHE) than control cells (C) grown in soft agar. Scale bar, 100 μm. (E) shTSC2 induces ROS generation in DU145 cells grown in complete media. ROS levels were determined by flow cytometry after staining with DHE. (F) PC-3 cells with shTSC2 and/or shRb were cultured in complete media. ROS levels were determined by flow cytometry after staining with the fluorescent dye CM-H2DCFDA. (G) DU145 cells with shTSC2 and/or re-expressed Rb were cultured in complete media. The ROS levels are determined as described in (F). Error bars indicate ± SD.

