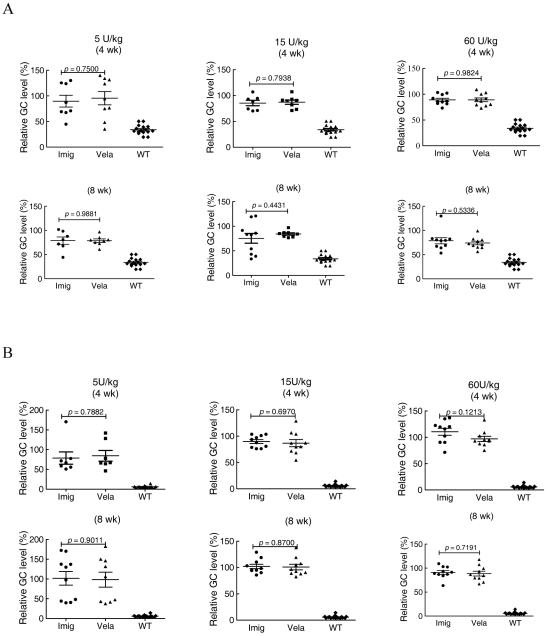
Figure 5. Effect of Vela or Imig on GC levels in Spleen (A) and Lung (B).
The graphs contain the GC values (mean ± SE) from 7–16 mice in each dosing cohort relative to the values from saline injected mice. The symbols and analysis methods are the same as in Figure 4.

