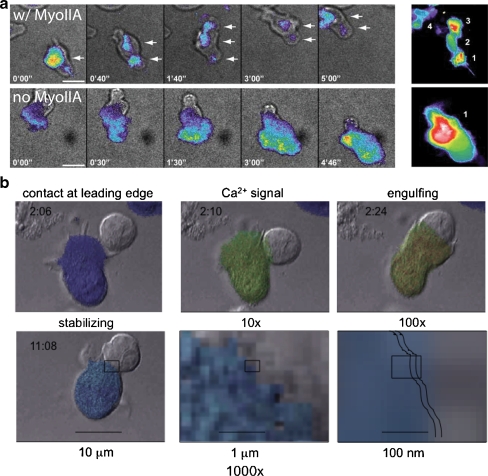
Fig. 2.
Motility modes for T cells and control of membrane–membrane contacts and control by calcium signaling. a Two modes of cell–substrate interaction during motility as observed in Jacobelli et al. 2009. Individual timepoints of contacts of actin–GFP bearing cells as visualized in TIRF, to visualize the contact surface, are shown. The right-hand panel is a time-sum of all the positions that the cell made with the surface during the entire time sequence. In the top (“w/ MyoIIA”): In a “walking” mode that gives rise to faster motility rates, T cells make multiple, sequential, and discrete contacts with the substrate. Bottom (“no MyoIIA”): In a “sliding” mode more akin to how mesenchymal cells move, cells make a continuous and large contact with the substrate, gliding along during propagation. b Formation of an immunological synapse. T-cell (fura-2 dye-loaded) and B-cell images from Negulescu et al. [26]. Colors indicate T-cell cytosolic Ca2+ (dark blue ∼50 nM to red >1 μM); times shown in each frame are minute:second. Contact is initiated by the leading edge of the T cell. The leading edge probes the APC for 20 s to several minutes before the contact area expands. Ca2+ signaling begins 10 s later. The Ca2+ signal can be oscillatory, transient, or sustained, as Ca2+ enters through CRAC channel Orai1 pore-forming subunits. The signal is sustained by K+ channel (Kv1.3 or KCa3.1) activity. Ca2+ must remain elevated for synapse stabilization, inhibition of motility, and NF-AT gene expression responses. Scale bars and boxes in lower panels indicate “zooming” into the synaptic region after initial stabilization of the synapse. Jagged lines indicate the approximate width of the synaptic cleft

