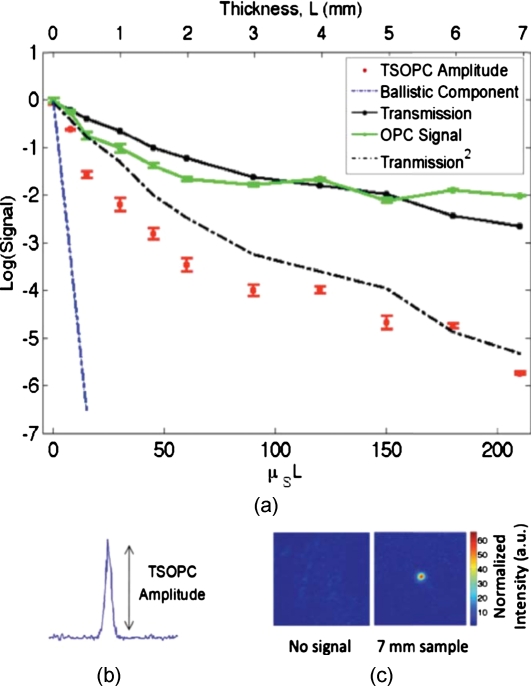
Figure 4.
(a) TSOPC amplitude (red data), ballistic transmission (blue line), total transmission (black curve), and OPC signal (green curve) as levels of scattering were increased. The square of the transmission (dashed curve) approximated the TSOPC amplitude in trend. Error bars represent the standard error over N ranging from three to seven measurements. (b) TSOPC amplitude was measured as the height of the focused spot after the background signal was subtracted. (c) Signal from the 7-mm chicken breast sample was clearly visible above the noise in the system. (Color online only.)

