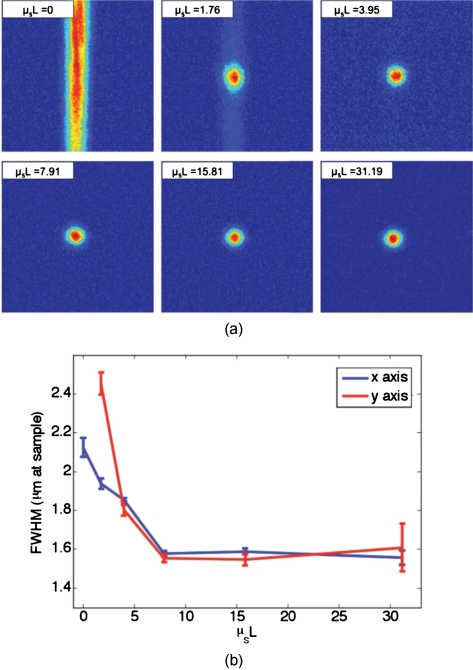
Figure 8.
Tissue-mimicking phantoms. (a) The top left panel shows that with no sample present the reconstructed signal forms a stripe rather than a spot. The other panels show that as the scattering is increased, the stripe is reduced to a near diffraction limited spot. (b) The reduction in the size of the focused spot in the x and y directions. The diffraction limit in this setup was calculated to be 1.2 μm. Error bars represent the standard error of the FWHM made over N=3 measurements.

