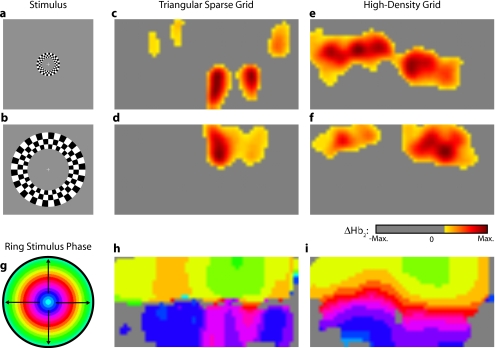
Figure 8.
In vivo measurement from a phase-encoded mapping study of visual eccentricity. The stimulus is an expanding counterphase flickering ring. There are a total of 36 activations in the entire rotation series. In order to line up stimuli and activations, we used our measured 6-s neurovascular lag. (a) and (b) Two frames from the stimulus. (c) and (d) Activations from these stimuli reconstructed with the triangular sparse array. Note the poor localization, especially when the activation passes beneath the source line, and the inability to always locate activations in both hemispheres. (e) and (f) Reconstructions using the high-density array. Activations are correctly placed with reasonable sizes. (g) Legend defining the phase of the target phase-encoded stimulus. (h) The phase of each pixel’s activation at the rotation frequency using the triangular sparse array. Note the ability to distinguish only two regions, and the conversion of vertical gradients into horizontal gradients, similar to Fig. 6p. (i) Phase mapping with the high-density array, which correctly locates all phases.

