
Fig. 2.
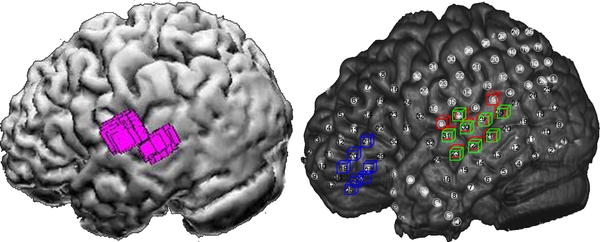
Left panel MEG MUSIC result (purple) in the left lateral temporal lobe, for one cluster in one patient, displayed on the rendering of the cortical surface. Right panel ECoG result for the same patient, showing marked electrodes for three spikes ranked 1st (red), 2nd (green) and 3rd (blue), displayed on the matched CT-MRI rendering, in which the actual grid electrodes are visible