
Fig. 3.
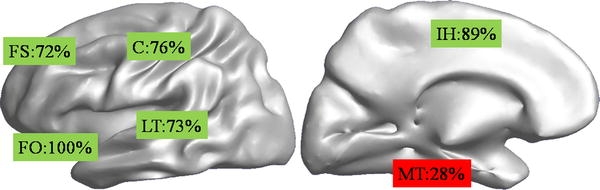
Percentages of ECoG spikes that where associated with a MEG cluster for different regions, depicted on an unfolded cortex. Shown are a left lateral (left) and inter-hemispheric (right) view. Regions indicated are the lateral temporal lobe (LT), central sulcus (C), fronto-orbital region (FO), inter-hemispheric region (IH), superior frontal gyrus (FS) and mesial-temporal region (MT)