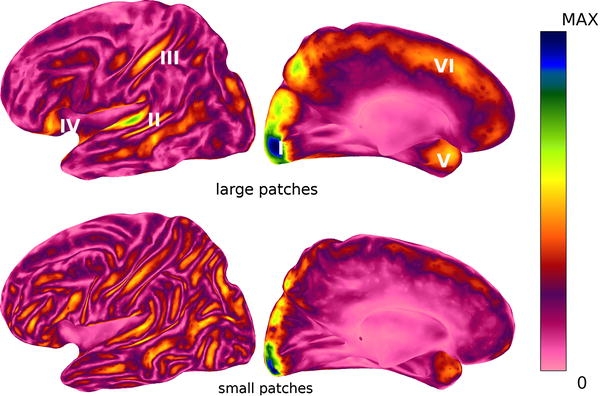
Fig. 4.

Maximum MEG field strength for large (~1200 mm2, upper panels) and small patches (~300 mm2, lower panels). Shown are a left lateral (left) and inter-hemispheric (right) view. Color maps are scaled from zero (pink) to maximal value (blue) occurring (0.95 pT for large, 0.37 pT for small patches). Increased sensitivity for large patches exists in the occipital pole (I), temporal plane (II), post-central sulcus (III), fronto-orbital (IV), temporal pole (V) and inter-hemispheric region/superior frontal gyrus (VI)
