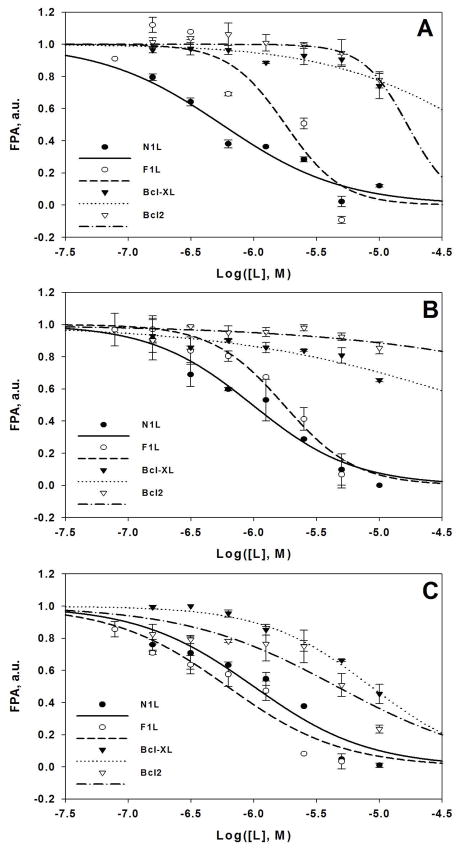
Figure 1. Determination of IC50 values of select N1L antagonists by fluorescence polarization experiments.
A. Ligand 7; IC50(N1L) = 0.6 μM; IC50(F1L) = 1.4 μM. B. Ligand 11; IC50(N1L) = 0.9 μM; IC50(F1L) = 1.7 μM. C. Ligand 12; IC50(N1L) = 0.9 μM; IC50(F1L) = 0.6 μM; IC50(Bcl-2) = 4.7 μM; IC50(Bcl-XL) = 8.5 μM. FPA, normalized fluorescence polarization; Log([L], M), decimal logarithm of the ligand concentration in M. Data were fit to the variable slope dose-response equation. FPA assay was performed as described in Methods. Incomplete titration curves (ligand saturation was not achieved in a given concentration range) are shown for Bcl-2 and Bcl-XL in panels A and B solely to demonstrate poor ligand binding to these proteins.

