
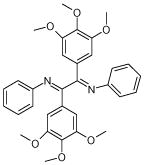
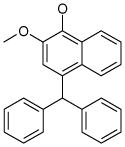
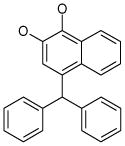
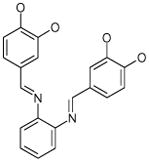
Table 1.
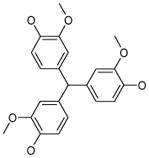
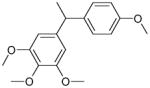
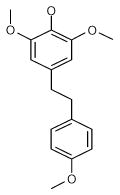
Best N1L antagonists obtained at each scaffold optimization round.
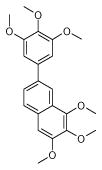
| 1 (ID2/I) | 2 (ID9/I) | 3 (ID10/I) | 4 trans-Resveratrol* |
 |
 |
 |
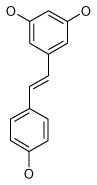 |
| IC50 = 8.8 μM | IC50 = 5.6 μM | IC50 = 5.0 μM | IC50 = 21.9 μM |
| XLogP = 4.1 | XLogP = 4.1 | XLogP = 3.7 | XLogP = 3.1 |
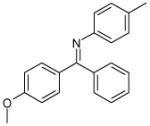
| 5 (ID13/II) | 6 (ID15/II) | 7 (ID23/III) | 8 (ID26/III) |
 |
 |
 |
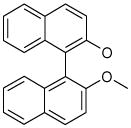 |
| IC50 = 2.4 μM | IC50 = 1.8 μM | IC50 = 0.6 μM | IC50 = 1.5 μM |
| XLogP = 6.7 | XLogP = 6.2 | XLogP = 5.8 | XLogP = 6.0 |
| 9 (ID29/III) | 10 (ID30/III) | 11 (ID31/III) | 12 (ID41/III) |
 |
 |
 |
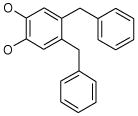 |
| IC50 = 1.2 μM | IC50 = 1.7 μM | IC50 = 0.9 μM | IC50 = 0.9 μM |
| XLogP = 2.6 | XLogP = 5.4 | XLogP = 4.6 | XLogP = 5.1 |
In parentheses, ligand IDs correspond to those in the Supplementary Table 1. Optimization round is indicated by a roman numeral next to ligands ID. Best IC50 values shown.
*
Resveratrol was added to the compound set because of its structural similarity to ligand 3. The octanol-water partitioning XLogP coefficients of the compounds were obtained from the PubChem database (http://pubchem.ncbi.nlm.nih.gov).