
Figure 1. Temporal trends in HAART initiation in the ALIVE cohort, 1996–2008.
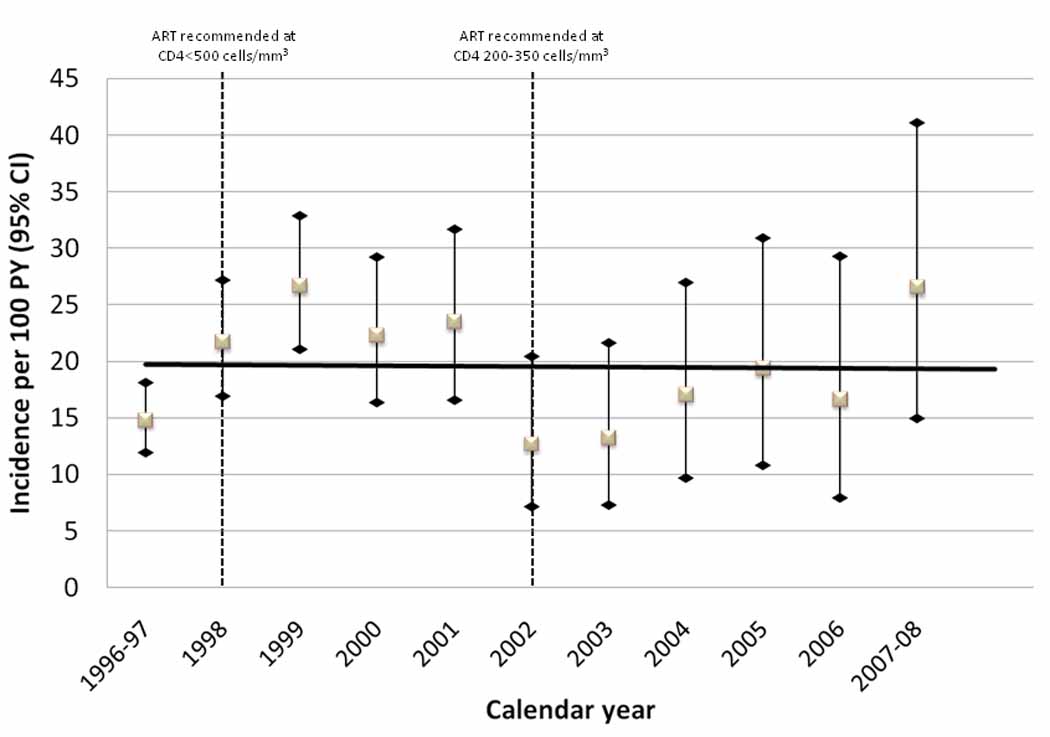
Incidence rates per 100 person years (PY) and 95% confidence intervals (CI) among treatment eligible IDUs (n=582) by calendar year are shown. There was no statistically significant linear trend (solid line). Dashed lines in 1998 and 2002 reflect changes in guidelines for antiretroviral therapy [20–22].