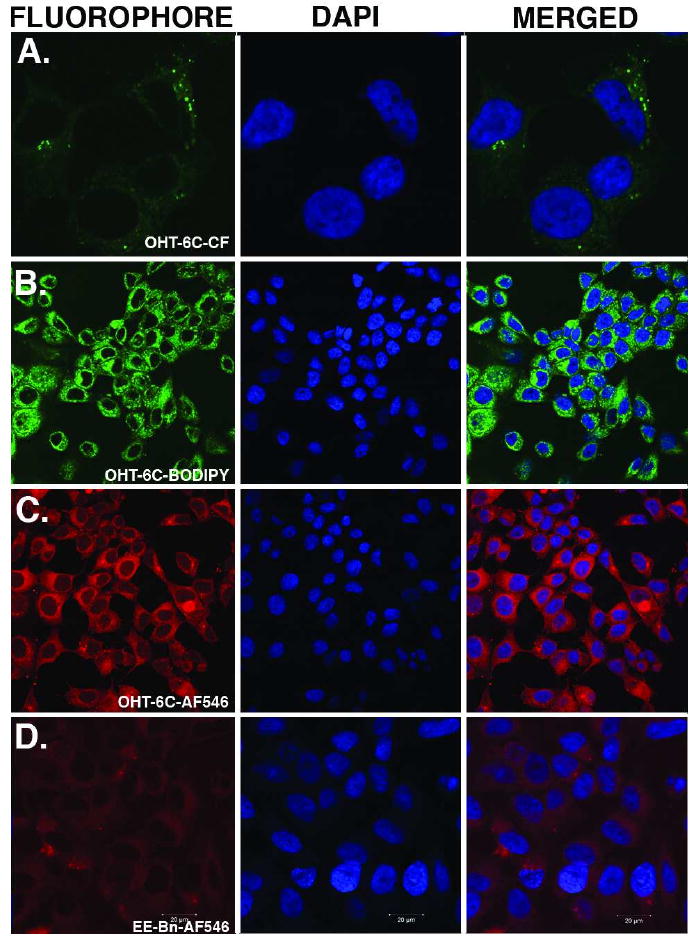
Figure 2.

Images of uptake of conjugates by ER-positive MCF7 cell line after 6 hours of dosing. Row A. 10 μM OHT-6C-CF; Row B. 100 nM OHT-6C-BODIPY; Row C. 10 μM OHT-6C-AF546; Row D. 1 μM EE-Bn-AF546. The first image of each row is the emission of the fluorophore. The second image of each row is the image of the DAPI nuclear stain and the third image is the merged picture of the first two images. Due to the relatively low brightness of the carboxyfluorescein conjugate, we have shown an image at higher magnification than the other fluorophores.
