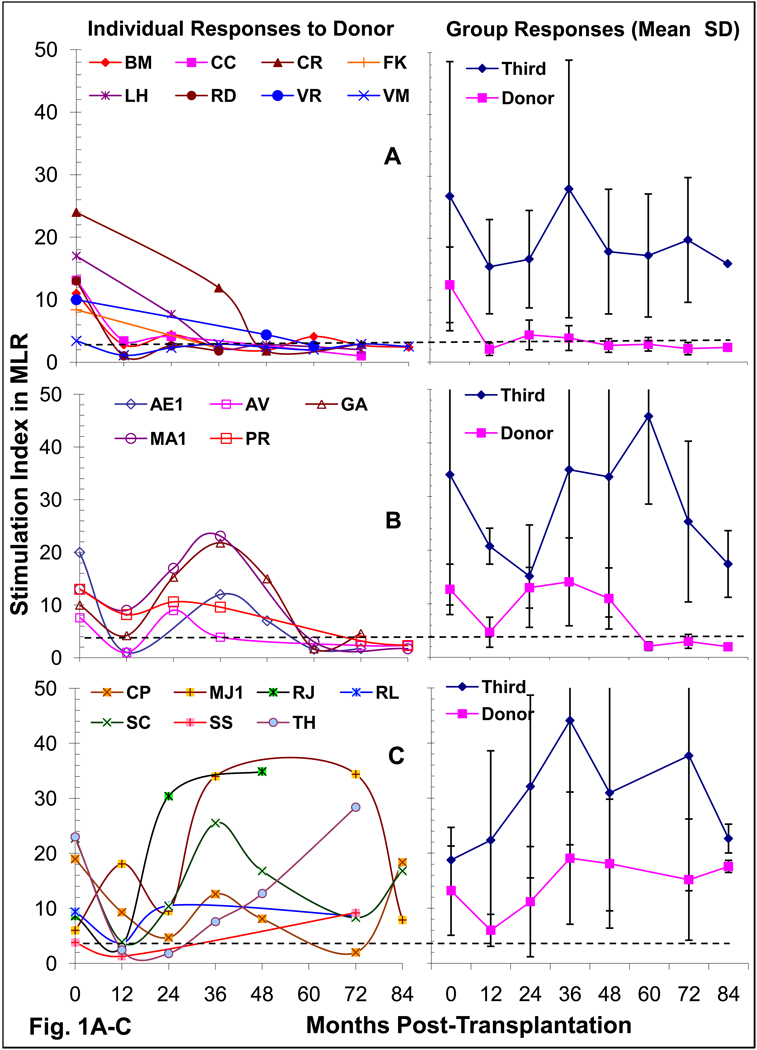
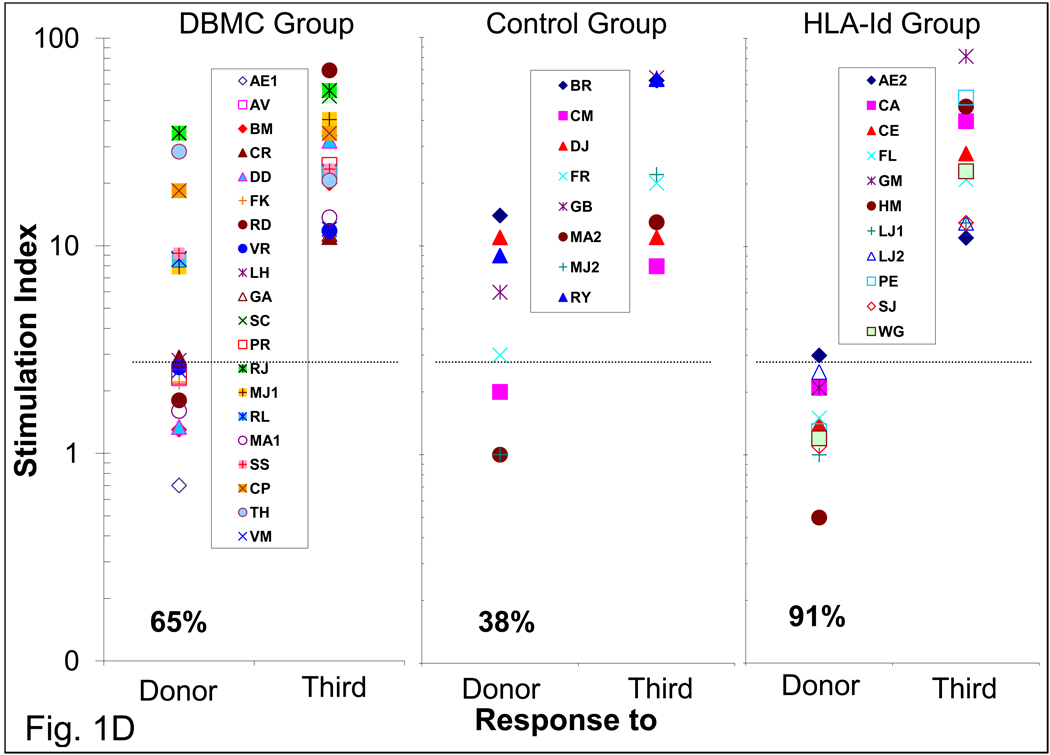
Figure 1. Mixed Lymphocyte Reaction (MLR) in Kidney transplant recipients.
1×10⁵ recipient responder PBMC were stimulated with 1×10⁵ donor or third party irradiated PBMC and standard 16-hr 3H-thymidine incorporation assays were performed after 7 days (peak proliferation). The stimulation indices (mean of triplicate cultures) categorized individual DBMC recipients into one of three patterns (A, B & C) of reactivity to the donor (left). On the right the mean ± SD responses to the donor and third party of the group are shown. In Fig. 1D, the SIs. of the three groups of patients are compared at 49–134 months post-transplant. SI. of 3 was considered the cut-off value for a positive response [11], represented by the dashed lines and the percentage of recipients showing unresponsiveness long-term are shown at the bottom. Please note that the data are shown in log-10 scale in Fig. 1D.


