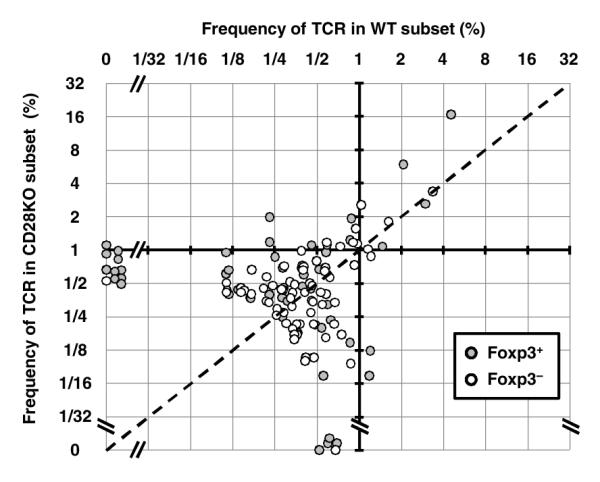
Figure 5.

Differential requirement of CD28 for thymic selection. TCRs with an average frequency in the Foxp3+ CD28 WT and KO data sets of > 0.25% were plotted (58 TCRs, grey dots). The same process was also used to select Foxp3− TCRs (71 TCRs, unfilled dots). These TCRs represent 29.9%, 56.2%, 35.4%, and 39.1% of the total data set for WT Foxp3+, KO Foxp3+, WT Foxp3−, and KO Foxp3− subsets, respectively. The dashed line indicates equal frequency in the CD28 WT and KO data sets. Note that there are 4 and 10 TCRs found only in the CD28 WT or KO Foxp3+ data sets, respectively. By contrast, one TCR is found only in the CD28 WT and KO Foxp3− data sets. Using the non-parametric Wilcoxon Rank sum test to compare the TCRs above the 0.25% threshold, TCR usage in Foxp3+ CD28 WT and KO cells is different (p < 0.01), whereas TCR usage in Foxp3− cells is not (p = 0.7).
