
Figure 3.
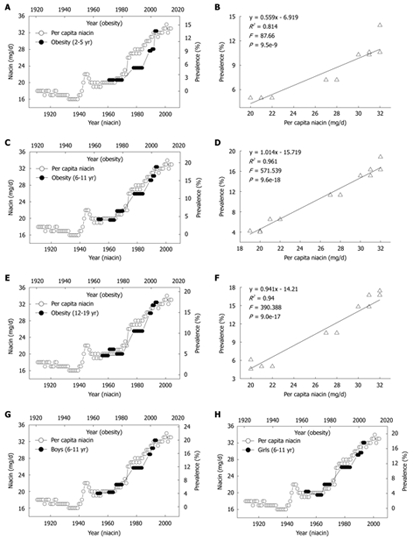
Correlations between US per capita niacin consumption and obesity prevalence in US children. A, C and E: The trends in the daily per capita niacin consumption in 1909-2004 (Ref. 5) and in the obesity prevalence in the children aged 2-5, 6-11 and 12-19 years (Ref. 28); B, D and F: The 10-year lag-regression plots of the obesity prevalence in different age groups against daily per capita niacin consumption using the data in A, C, and E; G and H: The obesity prevalence in the age group of 6-11 years of either sex in 1963-2004 (Ref. 29 and 30) increased in parallel with the per capita niacin consumption in 1953-1994.