
Figure 4.
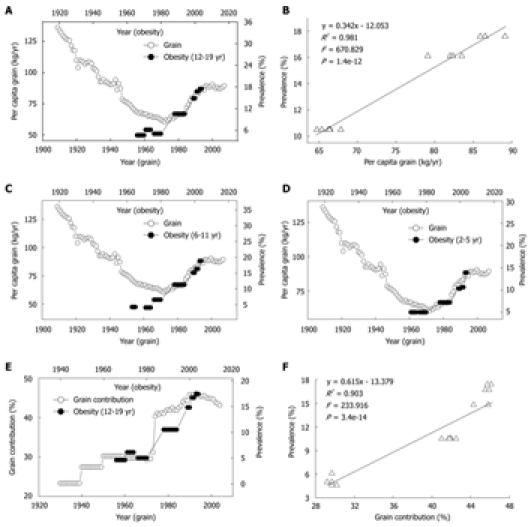
Correlations between consumption and contribution of grain and prevalence of obesity in US children. A: Trends in US per capita grain consumption in 1909-2007 (Ref. 31) and in the obesity prevalence in the children aged 12-19 years in 1966-2004 (Ref. 28); B: The linear regression plot of the obesity prevalence in 1988-2004 against grain consumption in 1978-1994 using the data in A; C and D: Relationships between the grain consumption (Ref. 31) and the prevalence of obesity in the children aged 6-11 and 2-5 years (Ref. 28). R2 = 0.902 (P = 7.1e-7) and 0.955 (P = 9.7e-9), for 2-5 years age group and 6-11 years age group; E: Trends in the grain contribution to niacin (Ref. 8 and Ref. 9) and in the obesity prevalence in the children aged 12-19 years (Ref. 28); F: The linear regression plot of the prevalence of obesity in 1966-2004 against grain contribution in 1956-1994 using the data in E.