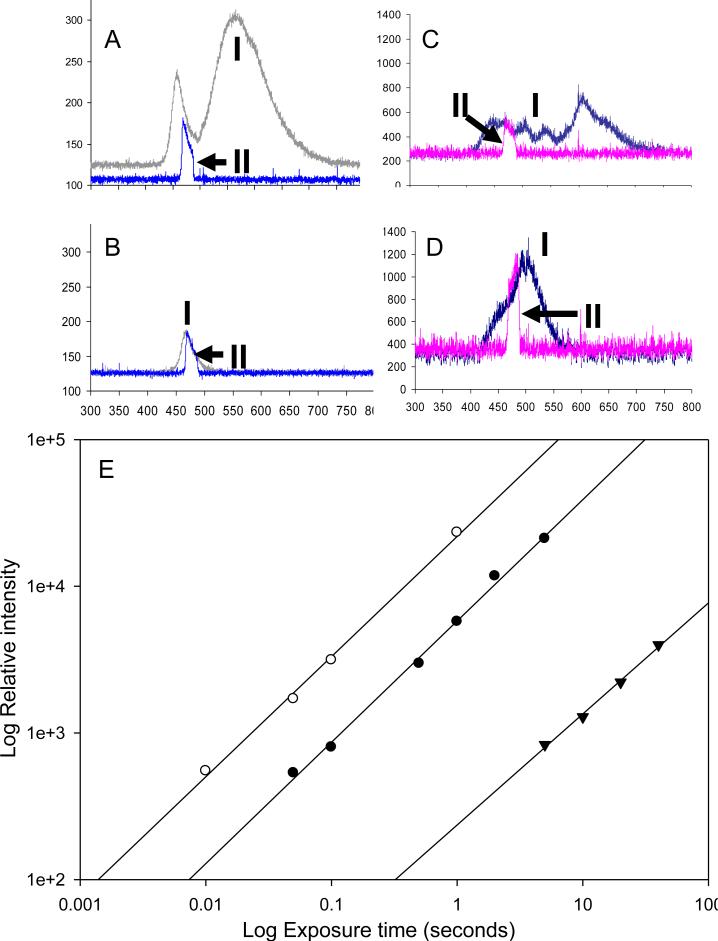
Figure 2. Light characteristics of the EL and LED illumination sources.
The spectra (measured by a spectrometer) and the light intensity of the LED were measured for the (A) white LED and the (B) blue LED illuminators (exposure time 100 ms) compared with the (C) white EL and (D) blue EL strips (exposure time 5 s). In panels A-D, the upper plots are measurements of the whole spectra (I) and the lower plots (II marked with arrows) are spectra measured with the blue filter, used for excitation of the FITC dye, in place.
To evaluate the actual signal from the assay, the fluorescence signal of 5 nM unquenched SNAP-25 peptide (labeled with FITC) was measured with various exposure times (ranging from 10 ms to 10 s) using a cooled CCD camera equipped with a blue emission filter and a green excitation filter. (E) The signal intensity measured at the CCD plotted as a function of exposure time for the different excitation sources white LED (white circles), blue LED (black circles), and the blue EL panel (black triangles). Note that both the exposure time axis and the relative intensity axis are plotted on a log scale.

