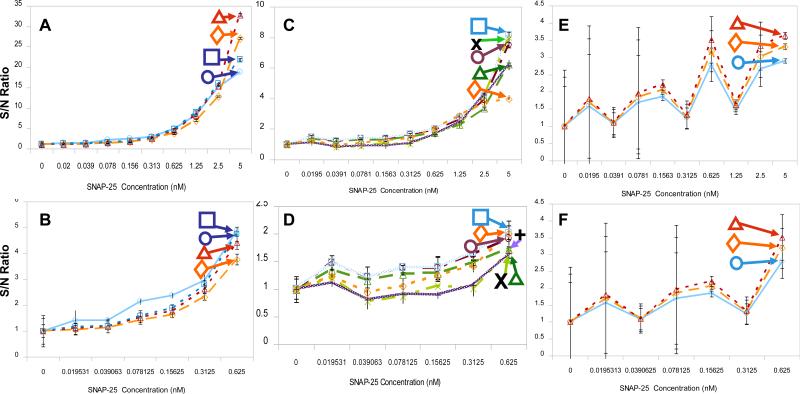
Figure 4. LED-CCD fluoresce analysis of unquenched SNAP-25 peptide.
A 50% dilution series of the unquenched SNAP-25 (labeled with FITC) and a control (no SNAP-25) was prepared, giving 10 samples with a final concentration range of 0 nM-5 nM. The dilution series was loaded in triplicate into each 30-well chip and the fluorescence excited using either the LED or EL illuminators. The CCD camera was used for detection. The signal-to-noise (S/N) ratio for CCD measured intensity as a function of the SNAP concentration was plotted for each of the EL and LED excitation method used. (A) Blue LED illumination (1 s-diamond, 2 s-triangle and 3 s-rectangle) and blue EL illumination (5 min-circle). (B) Expansion of the lower concentration range, 0 nM-0.625 nM, of SNAP-25 dose response curve from (A). (C) White LED illumination (1 s-X, 2 s-vertical line and 3 s-diamond/dashed line) and the shorter exposure times used for the blue EL (15 s- triangle, 30 s,- circle and 60 s- rectangle). (D) Expansion of the lower concentration range for the SNAP-25 dose response plotted in (C). (E) White EL illumination (15 s- circle, 30 s-diamond and 60 s- triangle). (F) Expansion of the lower concentration range for the SNAP-25 dose response plotted in (E). Standard deviations were determined from three separate readings of each chip.

