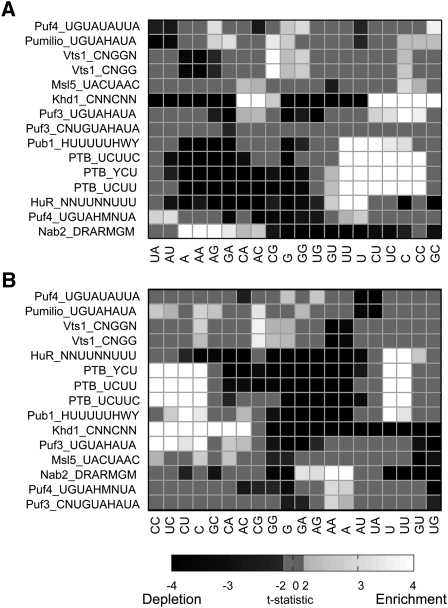
FIGURE 5.
Differences in dinucleotide composition around putative RBP binding sites between bound and unbound transcripts. (A) Heat map showing the t-statistic of the difference in di- and single-nucleotide frequencies in 40 bases upstream and downstream of the target site. (Rows) The RBP and its consensus binding sequence motifs (in IUPAC representation) used to identify target sites. (Columns) Single nucleotide versus dinucleotide. Rows and columns were ordered based on two-dimensional hierarchical clustering. Those t-statistics with absolute value <2 are not statistically significant at α = 0.05 and are set to 0; those with an absolute value >4 remain statistically significant after a Bonferroni correction and are thresholded at 4 or −4, as appropriate. (B) As for A, but using 20 bases up- and downstream.

