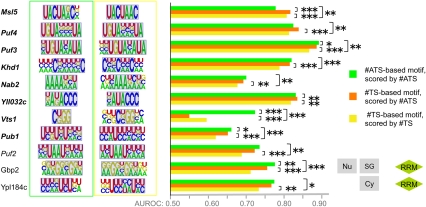
FIGURE 7.
RBP motifs optimized to distinguish bound versus unbound transcripts. Each RBP is shown associated with two motifs: the #ATS-derived motif with the highest AUROC (green box) and the #TS-derived motif with the highest AUROC (yellow box) after motif finding was performed on the complete set of bound and unbound transcripts. (Gray background) Overlap of manually aligned regions of the #ATS and #TS motifs for the same RBP. The bar graphs display median AUROC over 30 held-out test sets for motifs trained to maximize #ATS AUROC and scored with #ATS (green bar), trained to maximize #TS AUROC and scored with #TS (yellow bar), and trained to maximize #TS AUROC but scored with #ATS (orange bar). We assessed P-values for differences in distributions of 30 AUROCs on matched test sets using the Wilcoxon sign-rank test. (Italicized RBP names) The RBP has a previously defined consensus sequence, (bold italics) a significant increase in #ATS reported in Figure 3. The P-value threshold is indicated as for Figure 3, and exact P-values are available in Supplemental File 2. Subcellular location and RBD domains are displayed for RBPs not represented in Figure 3.

