FIGURE 4.
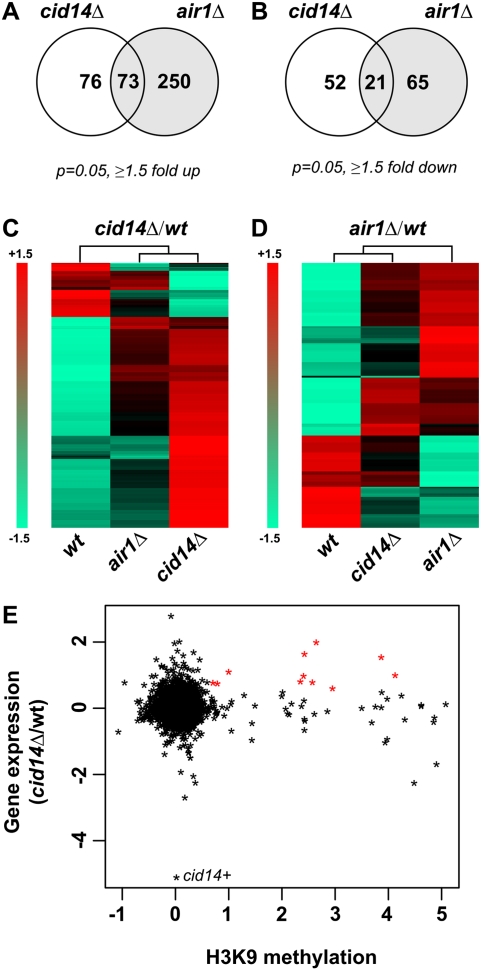
Differential gene expression in cid14Δ and air1Δ cells. (A,B) Venn diagrams showing the number of genes up- or down-regulated at least 1.5-fold in cid14Δ or air1Δ cells compared to wild type (P = 0.05) on S. pombe tiling arrays. Two biological replicates were analyzed. (C) Heatmap displaying the genes which were up- or down-regulated at least 1.5-fold (P = 0.05) in cid14Δ cells compared to wild type on S. pombe tiling arrays. (D) Heatmap displaying the genes which were up- or down-regulated at least 1.5-fold (P = 0.05) in air1Δ cells compared to wild type on S. pombe tiling arrays. (C,D) Artificially scaled expression values are shown for the strains indicated (−1.5 is set for the gene with the lowest expression and +1.5 is set for the gene with the highest expression). (E) Comparison of genes up-regulated in cid14Δ cells to previously published H3K9me2 ChIP-on-chip data (Cam et al. 2005). Asterisks in red indicate those genes that have a value >0.6 (log scale) in both the expression and ChIP experiments (listed in Supplemental Table S2).

