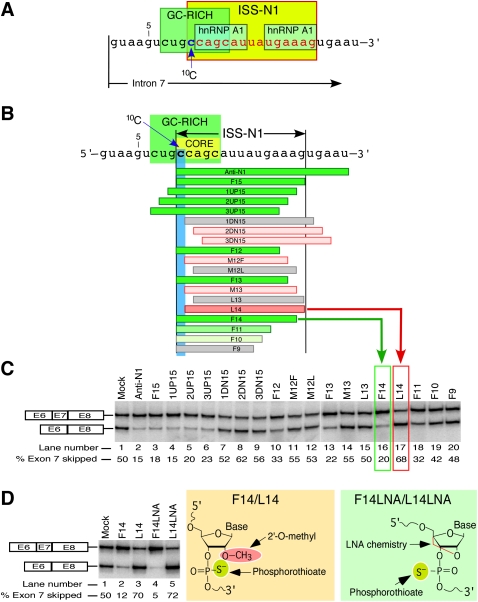
FIGURE 1.
An ultra-refined antisense microwalk reveals the significance of a cytosine residue at the 10th position (10C) of SMN2 intron 7. (A) Diagrammatic representation of cis-elements at the 5′ end of SMN2 intron 7. ISS-N1 is highlighted in yellow with all but the first nucleotide shown in red. Two hnRNP A1 motifs are indicated as described by Hua et al. (2008). GC-rich sequence is highlighted in green (Singh et al. 2009). Numbering of nucleotides starts from the first position of SMN2 intron 7. The location of 10C is marked by an arrow. (B) Diagrammatic representation of ASOs and their annealing positions relative to ISS-N1 region. Numbering of nucleotides starts from the first position of intron 7. Boundaries of ISS-N1 are demarcated. The first ISS-N1 residue, 10C, is highlighted in blue. The GC-rich sequence (Singh et al. 2009) is highlighted in green. The core sequence of the antisense target is highlighted in yellow. ASOs are shown as horizontal bars. Green bars represent ASOs that promote SMN2 exon 7 inclusion (exon 7 skipping is ≤45%). The intensity of green color reflects the strength of ASO stimulatory effect. Gray bars represent ASOs that have no effect on SMN2 exon 7 inclusion. Pink bars represent ASOs that promoted SMN2 exon 7 skipping (exon 7 skipping is ≥55%). To emphasize that L14 caused the most dramatic increase in exon 7 skipping, it is shown as a dark pink bar. (C) Splicing pattern of endogenous SMN2 after treatment with ASOs shown in panel B. SMA type I patient fibroblasts (GM03813) were treated with 20 nM of different ASOs and the total RNA for in vivo splicing assay was isolated 24 h post-transfection. The upper band corresponds to exon 7–included product; the lower band corresponds to exon 7–skipped product. The percentage of exon skipping was calculated from the total value of exon-included and exon-skipped products. The values represent mean of three independent experiments. The standard deviations were <5% of mean. The effect of F14 and L14 are highlighted with a green and red box, respectively. (D) Splicing pattern of endogenous SMN2 after treatment with 50 nM of indicated ASOs. The chemistry of the ASOs used is shown on the right. In vivo splicing assays were performed and analyzed as described in panel C. The values represent mean of three independent experiments. The standard deviations were <5% of mean.

