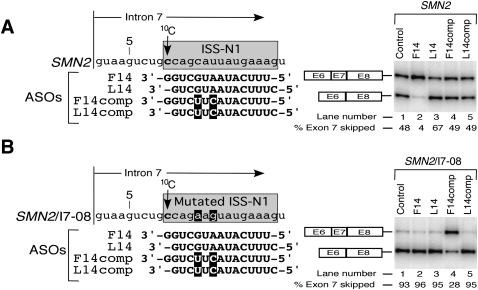
FIGURE 2.
Effect of ASOs are specific to their targets. (A) Diagrammatic representation of the target area in intron 7 of SMN2 minigene. ISS-N1 is highlighted in light gray. Numbering of nucleotides starts from the first position of intron 7. The location of 10C is marked by an arrow. The sequences of four ASOs and their annealing positions in ISS-N1 region are shown. Mutations are indicated in white letters and highlighted in black. Effect of ASOs on splicing of SMN2 minigene is shown on the right. HeLa cells were cotransfected with 50 nM of a given ASO and 0.1 μg of SMN2 minigene. Splicing was determined 24 h after transfection. The percentage of exon 7 skipping was calculated as described in Figure 1C. (B) Diagrammatic representation of the target area in intron 7 of SMN2/I7-08 minigene. ISS-N1 is highlighted in gray. Numbering of nucleotides starts from the first position of intron 7. Location of 10C is marked by an arrow. Sequences of four ASOs and their annealing positions are shown. Mutations in ISS-N1 area as well as in the ASOs are indicated in white letters and highlighted in black. Effect of the ASOs on splicing of SMN2/I7-08 minigene is shown on the right. In vivo splicing assays were performed and analyzed as described in panel A.

