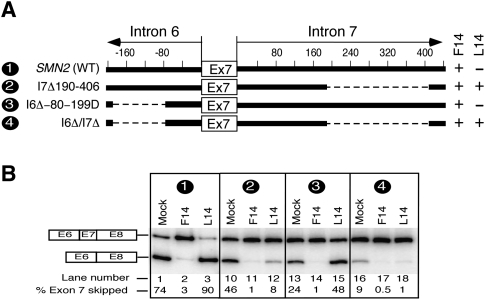
FIGURE 6.
Effect of deletions within intron 6 and intron 7 on antisense response of ISS-N1-targeting ASOs. (A) Diagrammatic representation of the deleted regions in intron 6 and 7 of SMN2 minigene. Deletions are represented by dotted lines. Positive numbers indicate nucleotide positions within intron 7 and start from the first position of this intron. Negative numbers indicate nucleotide positions within intron 6 and start from the last position of this intron. Names of mutants are given on the left; numbers in names reflect positions of the first and the last deleted nucleotides. A deletion mutant producing a stimulatory effect in presence of an ASO is shown as plus, whereas a mutant producing a negative effect in presence of an ASO is shown as minus. (B) In vivo splicing pattern of wild-type and mutant SMN2 minigenes shown in panel A. Minigenes were cotransfected with an ASO of interest. Cotransfections and splicing analyses were done similarly as in Figure 2A.

