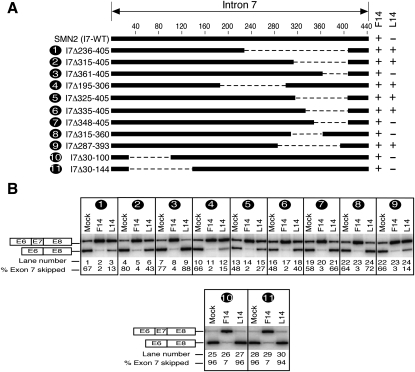
FIGURE 7.
Effect of deletions within intron 7 on antisense response of ISS-N1-targeting ASOs. (A) Diagrammatic representation of the deleted regions within intron 7 of SMN2 minigene. Deletions are represented by dotted lines. Numbers indicate nucleotide positions and start from the first position of intron 7. Names of mutants are given on the left; numbers in the names reflect positions of the first and the last deleted nucleotides. A deletion mutant producing a stimulatory effect in presence of an ASO is shown as plus, whereas a mutant producing a negative effect in presence of an ASO is shown as minus. (B) In vivo splicing pattern of mutant SMN2 minigenes shown in panel A. Minigenes were cotransfected with an ASO of interest. Cotransfections and splicing analysis were done similarly as in Figure 2A.

