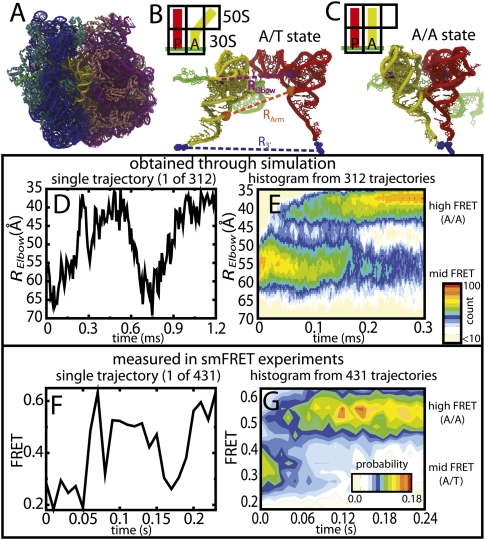
FIGURE 1.
Reversible fluctuations observed in simulations and smFRET. (A) Structure of the 70S ribosome with 16S rRNA (blue), 30S proteins (cyan), 23S rRNA (purple), 50S proteins (pink), mRNA (green), aa-tRNA (yellow), and p-tRNA (red) shown. aa-tRNA shown in the (B) A/T conformation and (C) A/A conformation. The purple dashed line, RElbow, is the distance between U47 of the aa-tRNA and U8 of the P-site tRNA (purple spheres), used experimentally, and computationally (distance between O3′ atoms), to measure aa-tRNA elbow accommodation. The orange dashed line, RArm, is the distance between the C3′ atom of G4 in the aa-tRNA and C5′ atom of G67 in P-site tRNA (orange spheres), which measures acceptor arm accommodation. The blue dashed line, R3′, is the distance between A-site and P-site amino acids (blue spheres), which measures 3′-CCA end accommodation into the peptidyltransferase center. (D) Time trace of RElbow for a single accommodation simulation. (E) P(RElbow, t), the unnormalized probability, was calculated from 312 independent accommodation transitions (12 million sampled structures). Values are colored off-white (low) to red (high), on a log scale, throughout all figures. Since FRET efficiencies are inversely related to RElbow , the Y-axes in D and E are inverted for easier comparison with F and G. (F) Single-molecule time trace monitored after stop-flow delivery of cognate EF-Tu·GTP·Phe-tRNAPhe(Cy5-acp3U47) to surface-immobilized ribosome complexes carrying fMet-tRNAOH in the P-site (Cy3-s4U8). (G) FRET population histogram of single FRET traces postsynchronized to a FRET value of 0.323. Population only includes traces where the tRNA reaches the A/A state (N = 431). Note: Reversible fluctuations were observed in many simulations and FRET traces and each trace has a unique profile. The uncanny similarities between the shapes of D and F are coincidental.

