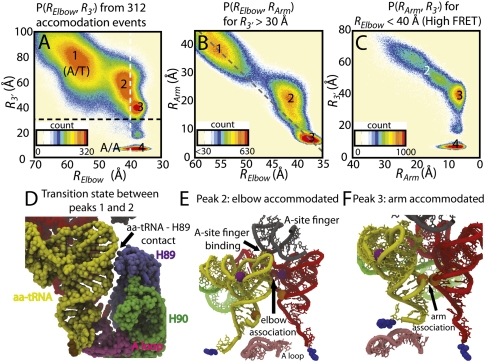
FIGURE 2.
Probability distributions reveal sequential elbow, arm, 3′-CCA end accommodation. (A) P(RElbow, R3′) shows four highly populated conformations: (1) A/T, (2) elbow accommodated, (3) acceptor arm accommodated, and (4) A/A states. Peaks are numbered consistently between plots, i.e., the same structures compose peak X (= 1,2,3,4) in each figure. (B) P(RElbow, RArm) prior to 3′-CCA entry into the PTC (R3′ > 30 Å, above the black dotted line in A). The bend in the probability distribution, centered about peak 2, indicates sequential elbow-arm accommodation. Simultaneous elbow and arm accommodation events would fall on the gray dashed line, which connects peaks 1 and 3. (C) P(RArm, R3′) for elbow-accommodated structures (RElbow < 30 Å, right of white dotted line in A). RArm and R3′ are correlated, but the arm reaches the A/A conformation, while the 3′-CCA end is ∼40 Å from the PTC (peak 3). (D) Representative snapshot of the transition state associated with elbow accommodation (between peaks 1 and 2 in A), where the tRNA closely approaches H89. (E) Snapshot of the elbow-associated state (peak 2) colored as in Figure 1 with the A-site finger (gray) and A loop (pink) also shown and rotated 90° from D. (F) Representative structure of arm-accommodated state (peak 3).

