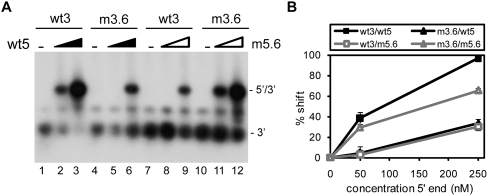
FIGURE 4.
Complex formation for mutant m5.6. (A) Radiolabeled wild-type (wt3) or mutant m3.6 3′ transcript was incubated with the unlabeled 5′ transcript wt5 or mutant m5.6. The samples were heated followed by slow cooling to room temperature after which the samples were analyzed on a native TBM gel. The position of the radiolabeled 3′ transcript and the 5′–3′ complex is indicated. (B) Two independent experiments were quantitated, and the percentage of complex formation is plotted as a function of the 5′ transcript concentration.

