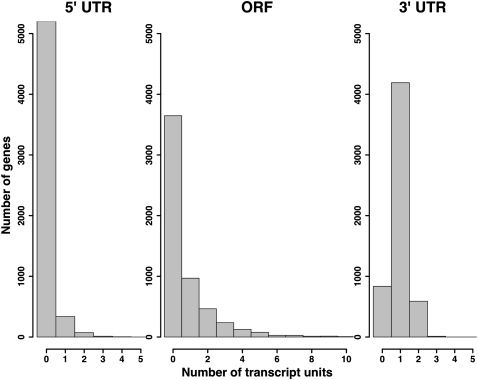
FIGURE 3.
Transcript ends cluster in gene elements. Each panel represents the frequency of genes containing dense clusters of transcript ends (transcript units, defined in Materials and Methods) from P1 3′-end RNA-seq, mapping to the indicated elements. (Left panel) 5′ UTRs; (middle panel) ORFs; (right panel) 3′ UTRs.

