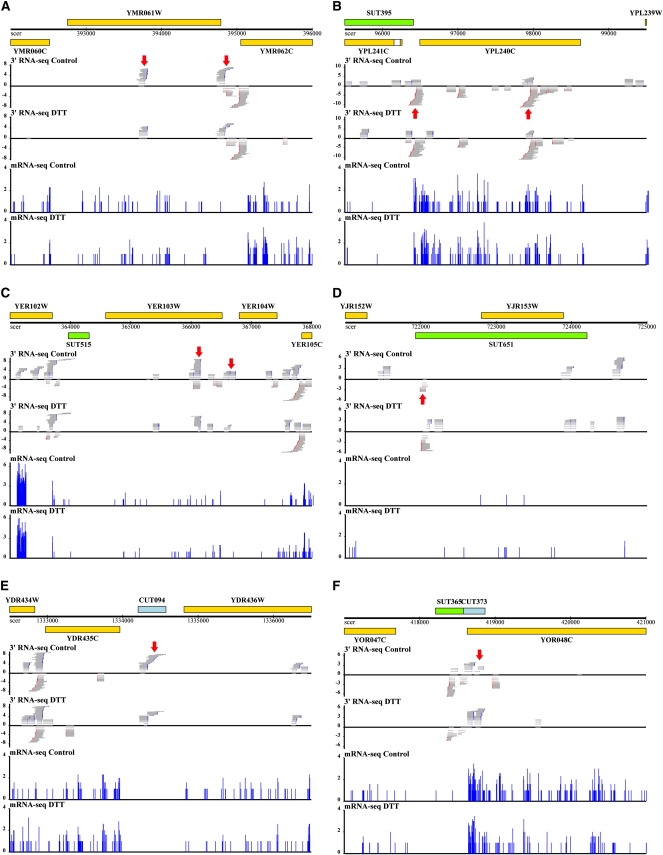
FIGURE 4.
Transcriptional profiles of example genes and intergenic RNAs. In each panel, genome annotations are shown at top: yellow, ORFs; green, SUTs (Xu et al. 2009); blue, CUTs (Xu et al. 2009). The bottom four plots in each panel report raw RNA-seq data. Gray horizontal bars represent reads from P1 3′ RNA-seq libraries constructed as in Figure 1, and blue vertical bars represent histograms of data from standard mRNA-seq as in Nagalakshmi et al. (2008). The x-axis reports the start position of a given read and the y-axis reports log2 of the number of reads mapping to the indicated position. For 3′-end RNA-seq libraries, reads mapping to the Crick strand are assigned negative counts; poly(A) tails are drawn in blue and reverse complement poly(T) tails in red. Control, RNA from cultures grown in rich media; DTT, RNA from cultures treated with dithiothreitol. Major transcript forms for genes and putative noncoding RNAs are indicated by red arrows. Panels represent genomic regions containing (A) YMR061W/RNA14, (B) YPL240C/HSP82, (C) YER103W/SSA4, (D) SUT651, (E) CUT094, and (F) CUT373.

