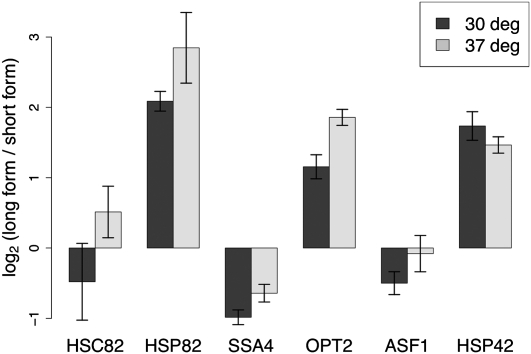
FIGURE 6.
Transcript length forms change in heat shock. Shown are transcript abundances measured by quantitative PCR with two primer sets per gene, one at the annotated ORF end (interrogating the long form of the RNA) and the other at the position of an internal 3′ alternative transcript end (interrogating the short form) inferred from 3′-end RNA-seq data. The y-axis reports the log2 fold-change in abundance between the two amplicons in RNA from cultures grown at 30°C (dark gray) and at 37°C (light gray); negative values correspond to loci at which the short form of the RNA is more abundant than the long form. Cultures were grown to ∼3.5 × 10⁷ cells/mL for RNA used to quantitate HSP82 and HSC82, and ∼1.0 × 10⁷ cells/mL for all other genes.

