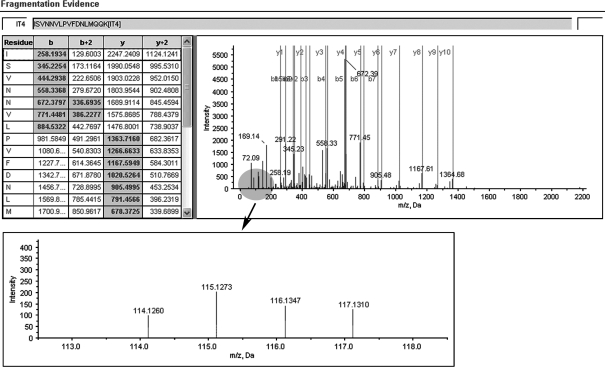
Figure 3.
A representative MS/MS spectrum showing a peptide, ISVNNVLPVFDNLMQQK (top panel), from cathepsin D, with the representative quantitation information of the peptide (bottom panel). The ion assignments are as follows: NNET, iTRAQ 114; NPC WHO type I, iTRAQ 115; NPC WHO type II, iTRAQ 116; NPC WHO type III, iTRAQ 117.

