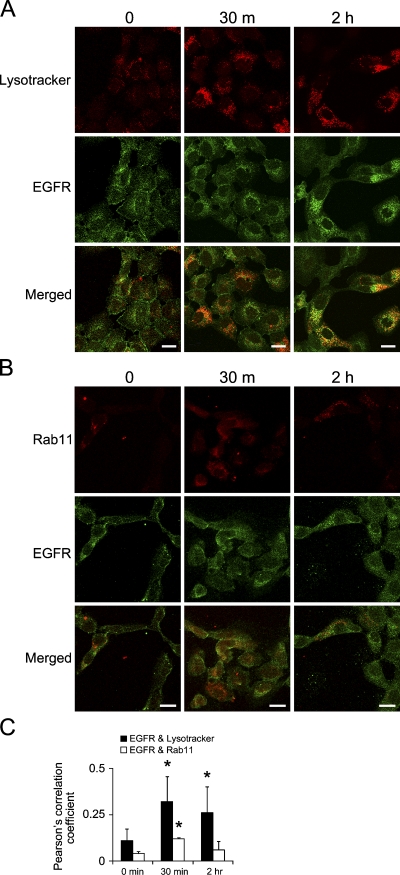
Figure 5.
Trafficking of wtEGFR upon acute activation of EGFRvIII. vIIIA1 cells were treated with AG1478 for 7 days, then EGFRvIII was acutely activated by removing AG1478 for the indicated times. Confocal microcopy images show colocalization of wtEGFR with (A) Lysotracker, a lysosomal marker, and (B) Rab11, a recycling endosome marker. Bar = 20 μm. (C) Quantification of colocalization by Pearson's correlation coefficients. Bars = mean ± SD, n=3 to 8 (n refers to number of images, each with 6–26 cells). Asterisk indicates statistically significant difference comparing the Pearson's correlation coefficient at different time points to time 0 min.

