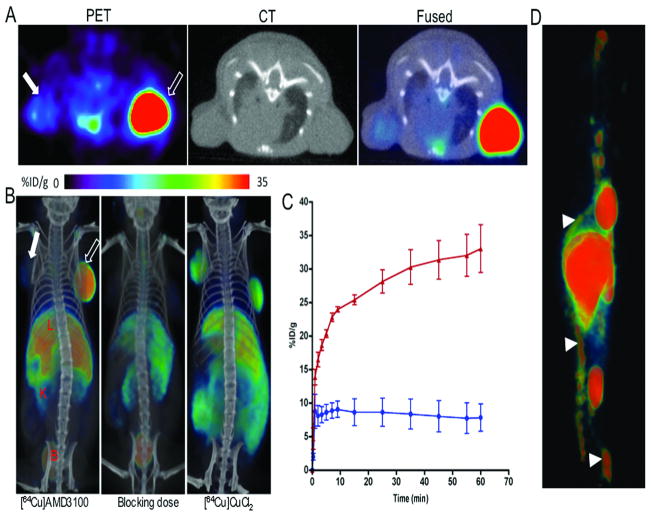
Figure 2. PET/CT imaging of CXCR4 expression in subcutaneous brain tumor xenografts with [64Cu]AMD3100.
NOD/SCID mice bearing U87 and U87-stb-CXCR4 glioblastoma xenografts on the left and right flanks, respectively, were given approximately 11.1 MBq (300 μCi) of 64Cu-labeled radiotracers via tail vein injection and PET/CT images were acquired. A, representative transaxial PET, CT and fused sections of both the tumors from a [64Cu]AMD3100 injected mouse at 90 min post-injection; B, volume rendered whole body images of [64Cu]AMD3100 (left panel), 50 mg/kg of AMD3100 blocking dose followed by [64Cu]AMD3100 (middle panel) and [64Cu]CuCl2 alone(right panel). All images were scaled to the same maximum threshold value. C, dynamic time-activity curves acquired over 60 min in mice injected with [64Cu]AMD3100. Data are means ± SEM of four animals. Specific accumulation of radioactivity in U87-stb-CXCR4 (red line) over U87 (blue line) is apparent. D, PET image of bone marrow uptake of [64Cu]AMD3100 at 90 min post-injection. Scale was adjusted for clear visualization of bone marrow. Solid arrow, U87 tumor; unfilled arrow, U87-stb-CXCR4 tumor; arrow head, bone marrow; L, liver; K, kidney; B, bladder.

