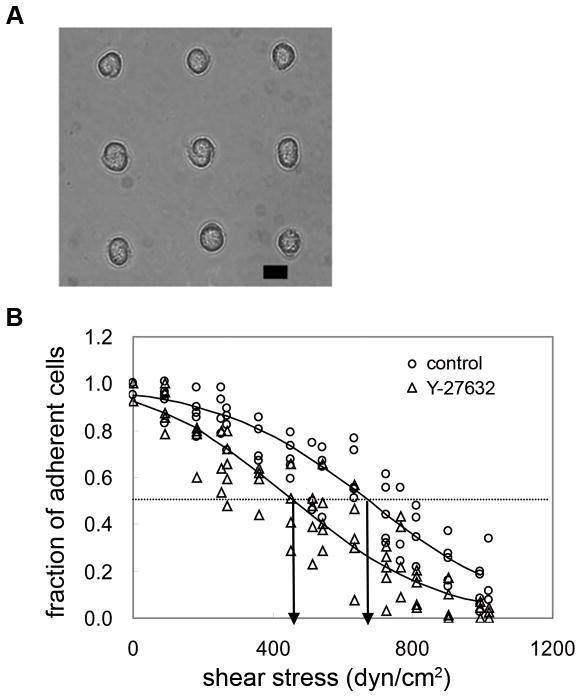
Fig. 1.
A, Phase contrast image of adherent NIH 3T3 cells cultured for 16 hours on micropatterned substrate (scale bar: 10 μm). B, Characteristic detachment profiles showing the fraction of adherent cells (f) vs. applied shear stress (τ). The shear stress for 50% detachment (indicated by arrows in the profile), τ50, represents the mean adhesion strength. Adhesion strength is 632 dyne/cm2 for untreated control cells, and is shifted left-ward to 451 dyne/cm2 for cell treated with Y-27632 (50μM).

