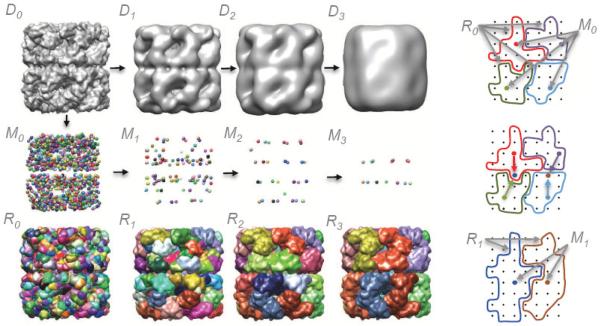
Figure 2.
The watershed segmentation of a density map, D0, is a set of regions, R0, with regions corresponding to points positioned at every local density maxima, M0. Density maps are shown using iso-surfaces, regions are drawn using smooth surfaces that enclose contained voxels, and points of local density maxima are drawn using spheres. Grouping by scale-space filtering moves the points in M0 by steepest ascent to local density maxima in D1, yielding new points M1. When two or more points in M1 coincide, the corresponding regions are grouped, as shown in the images on the right, producing R1. R3 results after two more smoothing and grouping steps, in which each region corresponds to a single protein. The illustrated density map was generated from PDB:1xck at 10Å resolution.

