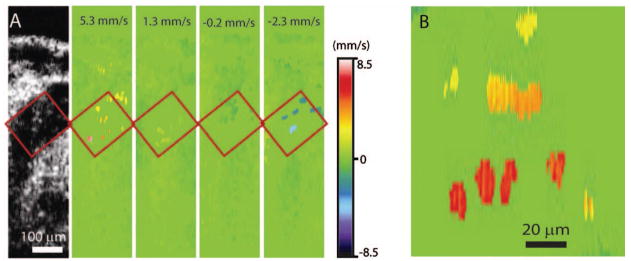
Fig. 2.

Doppler OCT velocity signals from blood cells on the embryonic day 8.5. A, Structural and corresponding color coded Doppler velocity images acquired at different phases of the heartbeat cycle. Green corresponds to zero velocity. Individual blood cells are distinguishable in the dorsal aorta. B, Magnified view of the same area showing Doppler signal from single cells as well as a small group of cells.
