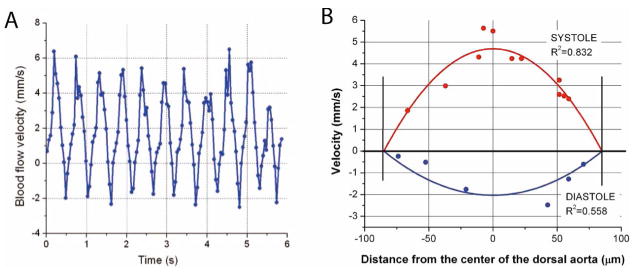
Fig. 3.

(Color online) Blood flow measurements at different phases of the cardiac cycle. A, Average blood flow velocity as a function of time in the corresponding area of the dorsal aorta. Each data point corresponds to the Doppler OCT velocity measurement from an individual cell. The data points were regressed using a parabolic fit. B, Blood flow velocity profiles. Each data point corresponds to the Doppler OCT velocity measurement from an individual cell. The data points were regressed using a parabolic fit.
