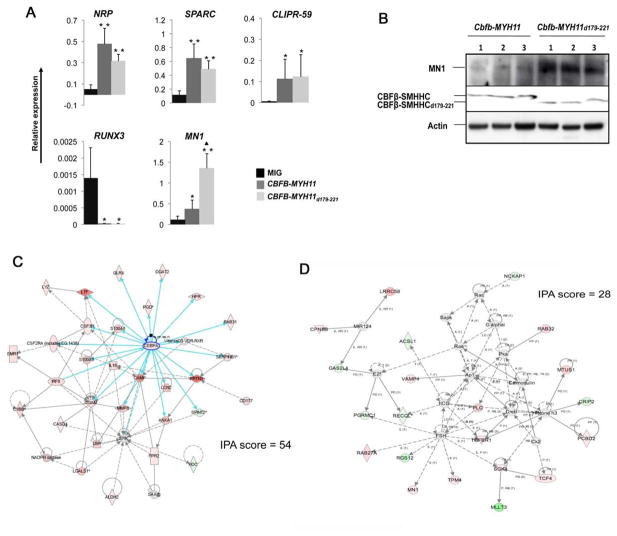
Figure 6. Similar gene expression changes induced by CBFB-MYH11 and CBFB-MYH11d179-221.
(A) qRT-PCR analysis of RNA samples from human CD34+ cell transduced with MIG, CBFB-MYH11, and CBFB-MYH11d179-221. Error bars represent SDs of 2 to 6 samples. *: P<0.05 between MIG and CBFB-MYH11 or CBFB-MYH11d179-221; **: P<0.01 between MIG and CBFB-MYH11 or CBFB-MYH11d179-221; ▲: P<0.05 between CBFB-MYH11 and CBFB-MYH11d179-221. The error bars represent one standard deviation.
(B) Western blot detection of MN1 expression in leukemia cells from Cbfb+/MYH11 and Cbfb+/MYH11d179-221 mice.
(C) Overexpression of myeloid genes in the Cebpa network from analysis of microarray data by Ingenuity Pathway Analysis (IPA). The blue arrows highlights connections directly from Cebpa. Pink colored genes are those that upregulated. More detailed information about the genes in this network is available in Table S1.
(D) The MN1 network identified by IPA analysis of microarray data. More detailed information about the genes in this network is available in Table S2.

